Results of Adaptive and Classical Tests are Highly Correlated
The standard approach to LLM evaluation is straightforward but inefficient: run models through massive static benchmarks, average the scores, and compare results. The problem is that most of these benchmarks force models to process thousands of items, many of which provide little meaningful information about the model's actual capabilities. It's like giving a high-school student a test that's only 10% calculus, and the rest is 60% basic addition and 30% PhD-level proofs: you're not really learning much about what they can do.
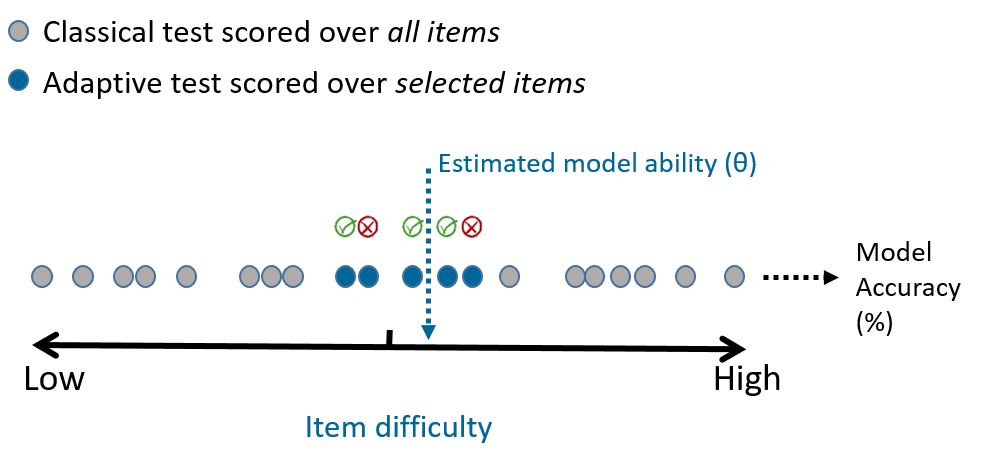
Computerised Adaptive Testing (CAT) has been quietly revolutionising educational testing for decades [1, 2, 3]. Instead of a one-size-fits-all approach, CAT dynamically adjusts question difficulty based on the test-taker's performance by selecting the most informative question at any given time. The process is intuitive: start with a medium-difficulty question, then adapt based on the response. Correct answer? Try something harder. Incorrect? Step back to an easier level.
Item Response Theory (IRT) is a probabilistic framework originating from psychometrics that forms the mathematical backbone for CAT systems. Being a theoretically grounded tried-and-tested method, IRT has already attracted the attention of researchers looking to make LLM evaluations more efficient [4, 5, 6, 7]. For example, Polo et al. [5] show that amongst various methods, IRT is the most effective at selecting a small number of representative evaluation examples, while maintaining within 2% accuracy of the full benchmark. However, adoption of these techniques for LLM evaluations in practice has so far been minimal. This is partially due to a lack of easy-to-use tools, but also because getting difficulty estimates for each question in a benchmark dataset, and keeping it up to date with the ever-evolving abilities of LLMs, is a colossal task. There are also fundamental differences in between applying IRT to humans vs. LLMs. Luckily, this is exactly the problem we’ve set out to solve at Trismik!
In the next section we explain the theory behind our adaptive testing solution for those who want to get an idea about its foundations. If you are not one of those, feel free to jump directly to the experiments and results section.
Item Response Theory
Unlike raw accuracy scores that depend entirely on which specific items you happen to test, IRT separates "how capable is the test-taker" from "how hard are the questions." This separation is what makes principled question selection possible.
The simplest form of IRT is the 1-parameter logistic model, or the Rasch model. It’s a latent variable model where the probability of getting a correct answer to a question is a logistic function of the difference between the test-taker’s latent ability θ and the item's difficulty :
For an adaptive testing algorithm to work, one first needs to estimate the difficulties of each question in the question bank and make sure that the difficulties remain well calibrated to the population being examined.
Once the difficulty values are obtained, the adaptive tests can be administered to each test-taker. The goal of the algorithm is to estimate θ as precisely as possible, while posing as few questions as possible.
The Adaptive Testing Algorithm
The key insight is that some questions are more informative than others for estimating ability. A question that's either too easy or too hard for the current ability estimate provides little information—you can predict the answer with high confidence regardless. The most informative questions are those which the test-taker has roughly a 50% chance of getting right, given their current estimated ability.
Each time the test-taker responds to a question, we update our estimate of their ability θ using Bayesian inference. We maintain a probability distribution over possible ability values, starting with a broad prior and progressively narrowing it as evidence accumulates. This approach naturally quantifies our uncertainty about the ability estimate through the posterior distribution's width, allowing us to set precise stopping criteria based on measurement precision rather than arbitrary question counts.
Can adaptive tests recover model rankings?
The most basic purpose of evaluations — as evidenced by the popularity of leaderboards — is to get a ranking of various models on how well they perform on a given task. We wanted to investigate how effectively our adaptive testing algorithm recovers relative model rankings given by their accuracy on the full test set.
Adaptive tests use fewer than 500 of the 5000+ questions, yet reliably recover model rankings.
A note on the datasets here: they are not the datasets in their original form and size. We applied some transformations to the questions, and have downsampled the collection so that there is a balanced spread of difficulties in the resulting set. This, in itself, does a lot of heavy lifting in removing redundant questions: these transformed datasets contain proportionally more questions for which we are uncertain whether a model will get right or not. Using these datasets as the full test set baselines allows us to isolate the effectiveness of our adaptive testing algorithm.
Experimental design
We ran classical and adaptive tests on five different datasets and seven different models. We chose models to a variety of different providers, model sizes, and abilities. The test sets span popular benchmarks across different domains and tasks.
For our experiments, we kept our system and user prompts very simple and did prompt tuning only to get answers in a reliable format, since our goal was not to maximise the model performances, but to investigate whether we can reach the same conclusion about which model and configuration is better than others with adaptive and classical testing. To keep the stochastic behaviour to a minimum, we queried all models with a temperature of 0, although this does not fully guarantee that there is no variation1. We made use of structured output when it was available.
Adaptive tests were all run with a target standard error of 0.2 and a maximum test length of 150 questions (you can vary these yourselves if you need more or less precision). All the runs terminated because they reached the target standard error, so all models were evaluated on fewer than 150 questions per adaptive run.
Results
While traditionally accuracy is used to compare model performances, the IRT-native metric is θ (theta), the hidden variable that quantifies the overall ability of the test taker. θ is a superior metric to accuracy because unlike accuracy, θ is invariant to the spread of difficulties in the questions administered to each model. We expect the rankings based on θ values to correlate with the accuracy scores from the full dataset, so this is what we report and compare here. It is also possible to derive a score on the same 0-1 scale as accuracy from the θ values — we call this θ-accuracy — which we explore more in the next section.
We compare the rankings from adaptive runs with those from classical accuracy in the table below. The reported θ values are the average of five independent runs, because we found that this increases the reliability of the estimates. Another option — which we don’t explore here — would be to make the stopping criteria more stringent by decreasing the target standard error and letting the adaptive algorithm run for longer.
The spearman correlation between the ranking from θ and the accuracy values is above 0.96 for 4 out of the 5 datasets.
| Model | Adaptive Rank | Classical Rank | Mean θ (n=5) | Accuracy |
|---|---|---|---|---|
| llama4-maverick-17b-instruct | 1 | 1 | 1.292 | 0.739 |
| gpt-4.1-nano | 2 | 2 | 1.290 | 0.717 |
| deepseek.r1 | 3 | 3 | 0.749 | 0.678 |
| gemini-1.5-flash | 4 | 4 | 0.606 | 0.628 |
| gpt-4o-mini | 5 | 5 | 0.409 | 0.603 |
| mixtral-8x7b-instruct | 6 | 6 | 0.165 | 0.565 |
| nova-micro | 7 | 7 | 0.136 | 0.532 |
| Model | Adaptive Rank | Classical Rank | Mean θ (n=5) | Accuracy |
|---|---|---|---|---|
| llama4-maverick-17b-instruct | 1 | 1 | 2.219 | 0.852 |
| deepseek.r1 | 2 | 2 | 1.757 | 0.797 |
| gpt-4.1-nano | 3 | 4 | 1.232 | 0.731 |
| nova-micro | 4 | 6 | 1.105 | 0.689 |
| gpt-4o-mini | 5 | 3 | 0.935 | 0.732 |
| gemini-1.5-flash | 6 | 5 | 0.863 | 0.724 |
| mixtral-8x7b-instruct | 7 | 7 | 0.054 | 0.579 |
| Model | Adaptive Rank | Classical Rank | Mean θ (n=5) | Accuracy |
|---|---|---|---|---|
| llama4-maverick-17b-instruct | 1 | 1 | 1.129 | 0.713 |
| deepseek.r1 | 2 | 2 | 0.954 | 0.699 |
| nova-micro | 3 | 3 | 0.819 | 0.689 |
| gemini-1.5-flash | 4 | 5 | 0.566 | 0.651 |
| gpt-4o-mini | 5 | 4 | 0.485 | 0.682 |
| gpt-4.1-nano | 6 | 6 | 0.404 | 0.632 |
| mixtral-8x7b-instruct | 7 | 7 | 0.241 | 0.601 |
| Model | Adaptive Rank | Classical Rank | Mean θ (n=5) | Accuracy |
|---|---|---|---|---|
| deepseek.r1 | 1 | 1 | 2.399 | 0.879 |
| llama4-maverick-17b-instruct | 2 | 2 | 1.238 | 0.733 |
| gemini-1.5-flash | 3 | 4 | 0.799 | 0.695 |
| gpt-4o-mini | 4 | 3 | 0.615 | 0.697 |
| gpt-4.1-nano | 5 | 5 | 0.536 | 0.631 |
| nova-micro | 6 | 6 | 0.187 | 0.568 |
| mixtral-8x7b-instruct | 7 | 7 | 0.123 | 0.523 |
| Model | Adaptive Rank | Classical Rank | Mean θ (n=5) | Accuracy |
|---|---|---|---|---|
| llama4-maverick-17b-instruct | 1 | 1 | 3.795 | 0.916 |
| deepseek.r1 | 2 | 2 | 3.588 | 0.910 |
| gemini-1.5-flash | 3 | 3 | 0.760 | 0.634 |
| gpt-4o-mini | 4 | 4 | 0.330 | 0.544 |
| gpt-4.1-nano | 5 | 5 | -0.684 | 0.424 |
| nova-micro | 6 | 6 | -0.832 | 0.407 |
| mixtral-8x7b-instruct | 7 | 7 | -1.007 | 0.380 |
Overall, we observe a very high correlation between the two rankings. The exception is trismik/LayMed2025, where the model performance on the accuracy metric is highly clustered: three models score within 0.01 points of each other. Interestingly, the θ scores are better differentiated, suggesting that the adaptive testing might be uncovering some underlying ability differences that the classical test is unable to differentiate.
Here is how the correlation evolves as we average over final thetas of more adaptive runs. Again, except for trismik/LayMed2025, we see that as the number of runs we average over increases, the correlation between the adaptive and the full test run rankings approaches very close to perfect. Note that even at 10 runs, the adaptive tests run only on 20% of the questions.
Efficiency of adaptive vs classical tests
Let’s take a closer look at our experiments on trismik/FinRAG2025 to understand how much faster and cheaper adaptive tests are compared to their classical counterparts. To obtain the accuracy of these five models on the full dataset, we spent approximately $21.72. On the other hand, running one adaptive test on each of these models costs only $0.43! Even with the repeated trials, the total amount we spent to get the adaptive ranks is only $2.15. This is a direct consequence of having to test only 8.5% of the questions. Note that the relative efficiency of adaptive testing gets more pronounced as the size of the full test set increases: adaptive tests would run the same number of questions even if the full dataset was twice the size.
From theta to accuracy and back
Ranking model performances is easy to motivate and understand, but at the end of the day, it’s a rather crude metric: it captures if a model is performing better than the other, but not how much. The problem is that θ and accuracy are on different scales. We expect an increase in θ to correspond to an increase in accuracy, but this relationship is not linear. This is where θ-accuracy comes into play.
The correlation between classical accuracy on the full test set and θ-accuracy from adaptive testing is above 0.97 for four out of the five datasets.
For a given dataset we know the estimated difficulty of each question, and each run of the adaptive testing algorithm gives us an estimate of θ for each model. This means that for each question, we can recover the probability of a model getting it right based on the model's estimated θ. Averaging out these probabilities gives us an estimate of the accuracy on the whole set, which we refer to as θ-accuracy. This process introduces multiple levels of estimation error but allows us to make an apples-to-apples comparison.
Overall, we see that the mean θ-accuracy is remarkably well correlated with classical accuracy, with correlation values exceeding 0.97 for four out of the five datasets. The lowest overall correlation is 0.895 on trismik/CommonSenseQA2025, where the θ-accuracy systematically underestimates classical accuracy, with more visible bias for lower performing models. This suggests that absolute difficulty values for this dataset are not as well calibrated to this group of models as the other datasets are. Interestingly, although there is a consistent bias in the estimated accuracies, the overall ranking of the models remains largely consistent.
Going forward
These results demonstrate the potential of adaptive testing for LLM evaluation. Adaptive tests use a fraction of the total questions but achieve correlation coefficients exceeding 0.96 for model rankings and 0.97 for θ-accuracy across most datasets.
The current implementation already shows strong performance, and as we gather more evaluation data across diverse models and tasks, our difficulty calibrations will become increasingly precise. We're also continuously refining the algorithm itself. We are working on developing more sophisticated selection mechanisms, better stopping criteria, and more robust uncertainty quantification. We expect significant improvements in both accuracy and efficiency as these algorithmic advances mature.
Perhaps most importantly, we're building this as a living system that evolves with the rapidly changing LLM landscape. Unlike static benchmarks that become outdated, our adaptive approach continuously learns from new models and maintains calibrated difficulty estimates as model capabilities advance. This means that as LLMs become more capable, our testing becomes more sophisticated to match.
The infrastructure we're developing will enable researchers and practitioners to get reliable model comparisons in minutes rather than hours or days, opening up new possibilities for rapid iteration, ablation studies, and real-time model monitoring. We're excited to see how the community leverages these efficiency gains to accelerate AI research and deployment.
References
[1] Winerip, M. (1993). No. 2 Pencil Fades as Graduate Exam Moves to Computer. The New York Times.
[2] SAT Suite: What Scores Mean - How Scores Are Calculated.
[3] Naismith, B., Cardwell, R., LaFlair, G. T., Nydick, S., & Kostromitina, M. (2025). Duolingo English Test Technical Manual.
[4] Lalor, J.P., Wu, H., & Yu, H. (2016). Building an Evaluation Scale using Item Response Theory. EMNLP.
[5] Polo, F. M., Weber, L., Choshen, L., Sun, Y., Xu, G., Yurochkin, M. (2024). tinyBenchmarks: evaluating LLMs with fewer examples. ICML.
[6] Zhuang, Y., Liu, Q., Pardos, Z. A., Kyllonen, P. C., Zu, J., Huang, Z., Wang, S., & Chen, E. (2025). Position: AI Evaluation Should Learn from How We Test Humans. ICML.
[7] Lalor, J. P., Rodriguez, P., Sedoc, J., Hernandez-Orallo, J. (2024). Item Response Theory for Natural Language Processing. EACL Tutorials.
Footnotes
-
Over 5 runs of the full test set, we observed up to 0.0017, standard deviations in accuracy for GPT-4.1-nano, and up to 0.00057 for Gemini-1.5-Flash. ↩